Leveraging Chrome Developer Tools for WordPress Development
One of the most common questions I see in forums, and when talking to people one-on-one is “how do you know?”
How do you know what style rules a specific element has? How do you know exactly what classes are applied to it? How can you tell that the script isn’t loading properly? There are JavaScript errors? How do you know what the return of an AJAX call is? And so on.
My answer is Chrome Developer Tools! All big browsers have developer tools built right in, which can give you a wealth of information about a website.
In this article we take a look at Chrome’s Developer Tools, but the general idea can be applied to all large browsers.
If you have Chrome open, go to View > Developer > Developer Tools or press Command + Shift + C on your Mac or Control + Shift + C on Windows to bring up the developer tools. Let’s get cracking!
Inspecting Elements
The foundation of any HTML/CSS information is the Elements section and the Element Inspector. When you fire up the tool this is the initial view (below). You should see the page’s HTML structure on the left and CSS rules on the right.
By default the inspector will be turned on. This can be switched on/off using the magnifying glass icon in the top left of the toolbar on top.
The inspector allows you to hover over an element on the page and click to select it. The HTML view on the left of the inspector will jump to that element, the CSS rules will display all the rules for it.

You can also click around within the left-hand side of the inspector to view specific elements, or use the arrow keys to move around.
One trick I like is that you can copy/edit/delete nodes. Right click on any element to copy it or edit it. You can delete the currently selected element by just pressing delete.
I use the delete method to figure out what is causing bugs, and also how pages look if a specific element isn’t shown.
Working With CSS
There are three ways you can use Developer Tools to your advantage:
- Get an overview of an element’s styles
- See all rules – what is overriding what and which selectors are used
- Add quick inline styles
Element Style Overview
When viewing an element, take a look at the right hand side of the tools window. To get an overview of the element styles switch over to the Computed tab on top.
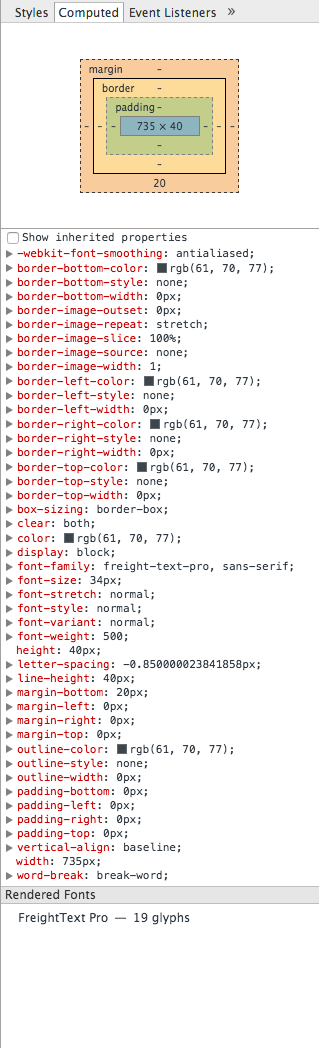
The image on the left shows an example of what you’ll see. Click on it to expand it into full view. The top section shows you the box model visually, and below you can see all the properties. The properties and their values are the result of the full cascade, which means that they show the end result of all your rules. By clicking on the black arrows next to each property you can see all the rules that contributed to it.
This is a handy view if you want to find the final value of a specific property or you want to get a good idea of the dimensions of an element. I’ve found, however, that if you need to keep referring to this view instead of the main Styles view it may indicate that your style rules are too complex. This is not a hard rule but it is something I’ve noticed across multiple projects.
View and Add Rules
The default view is the Styles tab, which shows you all the rules applied to this element. In the case of the second level heading shown above, you would see that there is a general font-weight associated with all headings, which is 400. There is also a rule applied to all second level headings which makes them 3.125em in size Finally the .article-style h2 selector is used to add styles to this specific element making the weight 500 and the font size 34px/40px.

This view is extremely useful because it allows you to judge how complex your rules are and – even better – allows you to modify and add things on the spot.
You can click on any property or value to modify it and even create new rules within each selector. By using the empty element.style selector on top you can even add inline styles which will overwrite everything else.
I use this view a lot to figure out three things: why my style rules aren’t working, what selectors I need to use to target an element and what elements would look like with modified CSS.
Next to the element.style section on the right there are two icons. The plus icon allows you to add a new style rule altogether, selector and all. The other icon opens a new section which allows you to check active, focus, hover and visited states. By checking these you can view the states and write specific rules for them.
Working With Javascript
The Developer Tools offers extremely powerful features for JavaScript and it’s a bit similar to an IDE in this respect. The reason JavaScript is easy to build features for is that it is mostly client-side so Chrome has access to everything it needs.
The Console
The console is the starting point for most Javascript debugging needs. It can give you all sorts of info, not just related to JavaScript.

In the screenshot above we can see some good advice (in blue) and two issues in red. The message is shown alongside the originating file which makes it easy to find where the problem is.
If you’re concatenating and minifying your Javascript don’t forget to generate an source map so you can see where the problems actually are, instead of just a nondescript line in a huge mass of code. Alternatively, you can wait with script minification until you push your product into production.
If you click the arrow to the left of the messages you’ll get some more information about the issue. By clicking the arrow for the 404 error we see that the issue is actually in global.js but it bubbles through to jquery.js. Clicking on the file will actually take you to that file, awesome!
Script Debugging
Sometimes our scripts don’t work and it’s not really clear why. Script debugging allows us to figure out problems and solve them easily. The usual way is to use breakpoints. The concept is fairly simple but the tools offer us so many features it’s a bit difficult to find your way.
Breakpoints are essentially intentional stop signs created which will cease code execution. Using various controls you can then inspect what is going on at the breakpoint (what variable values are used, etc) and continue execution when you’re ready.
Your first stop should be the Sources panel where you can open a file using Command + P (Control + P for Windows users). This opens the script on the left side, the tools on the right can be used to control the flow.

FREE EBOOK
Your step-by-step roadmap to a profitable web dev business. From landing more clients to scaling like crazy.

FREE EBOOK
Plan, build, and launch your next WP site without a hitch. Our checklist makes the process easy and repeatable.
You can set breakpoints by clicking the line numbers on the left. These will show up in the breakpoints section on the right. You can then run your script again which will stop at the specified points.

You can add conditional breakpoints and use this section for all sorts of other debugging magic. I strongly suggest reading Google Chrome’s documentation on Javascript debugging, it is extremely helpful!
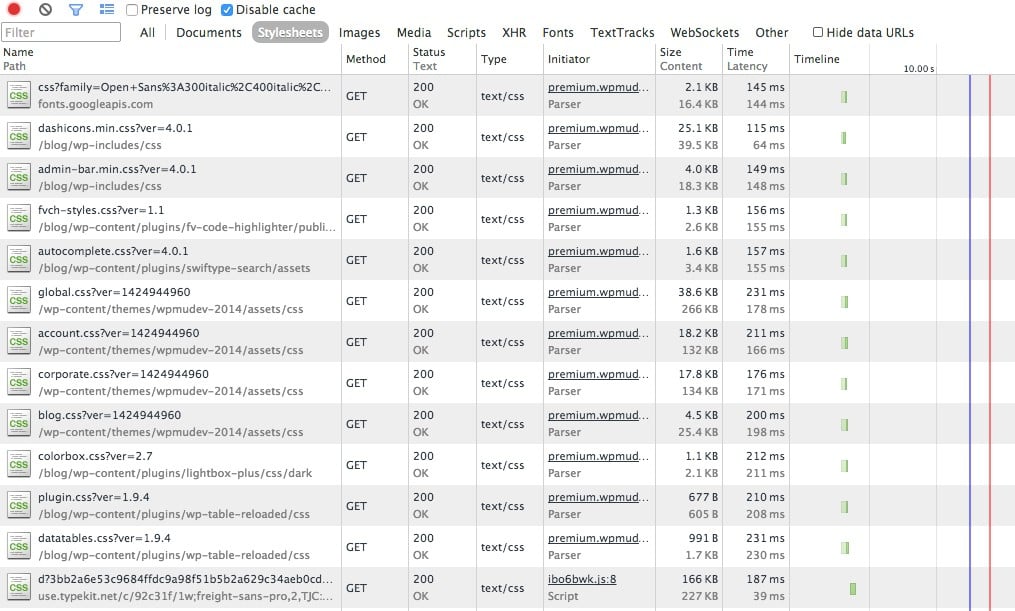
The Network Section
The Network section provides a wealth of data about requests and loaded assets. It shows things like the status of requests, their type, size, load times, loading timelines and so on. There is a lot you can learn here. I use it for the following:
- Troubleshooting bad requests
- Finding load time bottlenecks
- Checking AJAX request data
Bad Requests
Each items shows the request method, status and type. It is unusual to need to correct a method and a type but the status is very important. You should of course keep an eye out for 404 errors which will be marked red.
By clicking on the status header you can order the list by status. If you click it again 404 errors should be near the top since they will be sorted descending. You should also keep an eye out on redirects and anything out of the ordinary.
Loading Time Bottlenecks
The whole right side of this view shows horizontal bar charts of loading times. You may need to view it full-screen to get a proper view. If you see any bars which are longer than usual take a closer look, perhaps there is something going on!
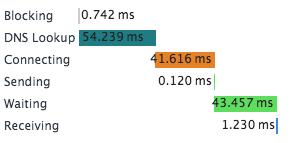
You can hover over a bar to get a lot of info like waiting time, DNS lookup, sending time, etc. Using this information you can weed out slow services, or even some slow code on your own website.
Checking AJAX Requests
This is my favourite part of the Developer Tools, it makes working with AJAX so much easier. AJAX requests are shown in the network tab, you can click the XHR filter on top to show only AJAX requests.
These will be shown on an ongoing basis. If you load a page and do something via AJAX the request will be added live. You can click on the request to view the headers, preview, response, cookies and timing. I spend most of my time in the response and headers section. Let’s look at an example.
Load up Dustin Curtis’ website – a pretty good read – and take a look at the XHR requests. You should see something like this:

Kudos is something you can give to articles on the Svbtle network. It’s clear that this request pulls in the Kudos given to the posts loaded on this page. If you load up the first article you should see that it indeed does have the number of Kudos shown in the response.
Now, keep your developer window open and hover over the Kudos facility. Once a Kudos is given you should see a new AJAX request. This request just returns true, it probably indicates to the javascript that the Kudos was received successfully.
Now, turn your attention to the Headers section. You can see the Form Data section in there which shows the data that was sent along with the request. This information, along with the response gives you all the data you need to troubleshoot your AJAX calls without resorting to echoing, alerting, console logging and all that nasty stuff.
Responsiveness Testing
What developer toolset would be complete without responsiveness testing? Chrome has one of the best interfaces for handling this. Take a look:

The controls on top make all the magic happen. You can select a specific popular device like an iPhone 5 or a Google Nexus S, or you can set custom dimensions. The cool thing is that Chrome also spoofs the user agent for you so instead of just making the same page thinner, it makes the website think it is actually being loaded by the specified device. Note that you need to refresh to make the spoofing happen.
You can also opt to throttle your network connection automatically. This helps to test in conditions where networks speeds aren’t great – you can see how annoying it is to use your site on a 50kb/s GPRS connection.
The little stepped icon on the left will open a menu that shows your specified media queries so you can quickly switch between them. I think this is pretty awesome!
Page Audits
This is a feature I came to very late, simply because it’s hidden in plain view. It doesn’t show anything and the option to run a site audit isn’t very visible, especially on large screens. Take a peek at the bottom and run a site audit with page reload.
It’s like having your own personal assistant! From speed to unused CSS rules, it analyses a so much and gives you a whole lot to do.

I use this tool whenever I create any new product, be it a whole website or just a plugin. It lets me know when I’m being sloppy or I’ve forgotten something.
Conclusion
Chrome Developer Tools is just great, and it offers so much information for making your website better. This is also one of the downsides – at first glance you get lost immediately. Getting to know this tool is a huge asset to development and definitely worth taking the time to learn.
In addition to the features I’ve touched on there is so much more, have a look around. If you feel you need more, visit the Extensions Gallery where you can find Chrome extensions, which add even more.
If you use a different browser like Safari or Firefox, they too have their own developer tools. For the most part they offer the same features via a different user interface. I personally prefer Chrome or Firefox due to the amount of extensions on offer.
Do you use Chrome Developer Tools? Let us know in the comments below.
Tags: